Processes, in the home view’s Places and as Show Processes in the command palette, is a simple task manager: name, PID, CPU, memory, disk read, disk write and threads, updated while it is shown. When the pane is narrow the disk and thread columns are dropped. The top shows the number of processes, the total CPU and the memory in use.
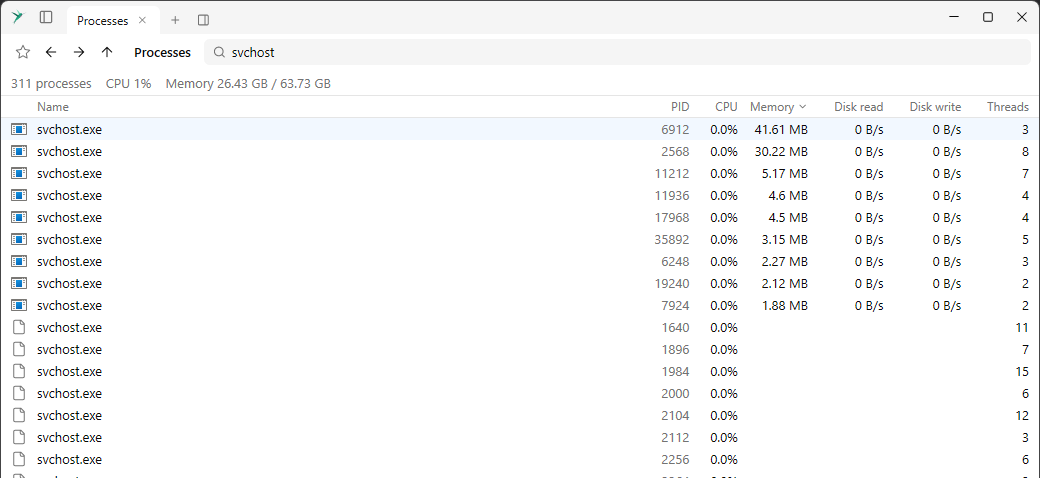
Memory is the active private working set, like Task Manager’s Memory column, and is 0 for a suspended process.
:mem filters on the same number. The preview panel shows the details of the selected process, with all the memory numbers of Task Manager’s Details tab.The context menu has Pin, End process, Suspend, Resume and Open file location. Pinned processes stay at the top whatever the sort, and are remembered by name. A click on the icon pins or unpins too.
When several processes have the same name, the context menu also has Kill 5 chrome.exe processes, with the number and the name of the selected process. It ends all of them at once without asking, including ones the filter hides.
Filter with words or
-word, :cpu > 5, :mem > 500mb and :pid 1234. Type ? in the filter for the help.Monitoring a process #
Monitor in the context menu, or Monitor Process in the command palette, keeps a panel for the selected process at the bottom of the window, whatever the window shows. You can monitor several processes, and on a narrow window a panel takes more than one row. It updates as often as the list and goes away when the process exits, or with its close button or Stop monitoring.
After the name, the PID and the CPU use, it shows:
Mmemory, as in the listTthreads andHhandlesWSworking set,PWSits peak andCScommit sizePFpage faultsDRandDWdisk read and write per secondIORandIOWthe number of read and write operations
Hover over a value for its full name and what it means, or over the name for the whole name and the path of the program.
A process that Windows doesn’t give access to shows
- for what can’t be read.